I would like to share this web app I developed some time ago, as part of a raspberry pi smart home github repository, in the zigbee/graph_view directory, that makes it much easier to query and display zigbee network graphs. The webapp is javascript only and is easily portable and can be integrated in other webapps.
Not only the grapg is available in one click, but for huge unreadable graphs, it’s possible to pan zoom to see each node in details.
To use it, it’s recommended to clone the repository and serve it with any python or node webserver, even vscode has a live-server plugin.
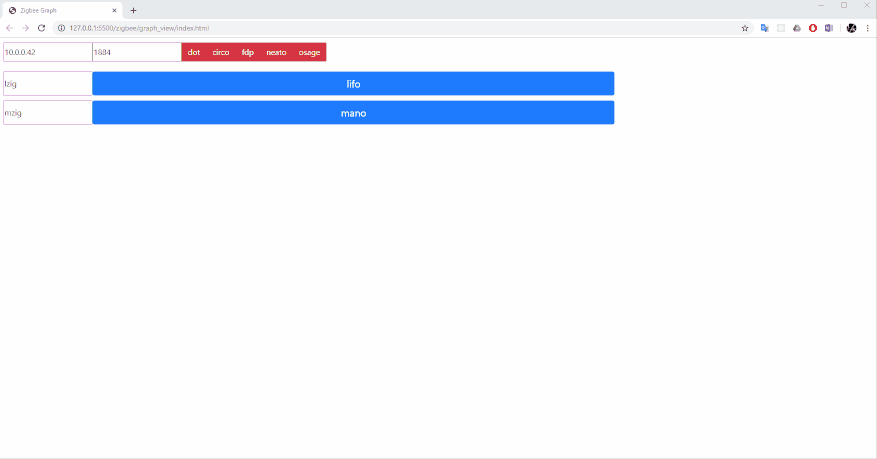
Usually, the difficult part with graphviz is that it’s difficult to predict which algo will provide the best view, so I added buttons to easily switch between algos rendering.
I also have two zigbee2mqtt instances, so I added shortcut buttons for each, but these are simply html buttons and each can customize the default server and port to his own network.
Please provide me any sort of feedback if you find this useful, or if it is redundant with any other existing app then please provide me the links. If you have any issues making it run, I’ll help by giving support.
Mainly if you have any ideas that can make this more accessible to everyone let me know. I’ve been thinking about having an npm module that would simply webserve it with express so that the users could run it exactly like zigbee2mqtt with a node call for example.
It’s also worth mentioning that this app is a thin layer between zigbee2mqtt and the main dependency d3-graphviz, which is a web port of the graphviz tool.